


Happy New Year! I hope everyone has had a restful break over the holiday season and a good start to 2025.
As I promised in my last post, here are some thoughts on the 2024 Supervisory Review and Examination Process (SREP) results. These were announced by the ECB on 17 December alongside its new Supervisory Priorities for 2025-2027.
SREP Scores Primer
The SREP is the ECB’s annual ‘health check’ on the (currently 114) banks (termed ‘Significant Institutions’ or SIs) under its direct supervision. Each year every bank is assessed again four criteria: Business Model, Internal Governance, Capital and Liquidity.
The scores for each element are then combined (not simply averaged) into a single overall score from 1 (low risk) to 4 (high risk). SREP scores then determine (according to a system or formula that the ECB does not disclose) each bank’s Pillar 2 capital requirement and Pillar 2 capital guidance. The ECB can also apply additional liquidity requirements as well as ‘qualitative’ requirements, for example to improve specific aspects of risk management or capital planning.
The ECB informs each bank confidentially of its individual score and requirements, and publishes aggregated scores for all SIs.
2024 SREP Scores: Stuck in the Middle
The latest SREP scores show a banking sector in moderate health. On average SIs scored 2.6, i.e. somewhere between ‘medium low’ and ‘medium high’ risk.
One striking feature of the scores is how clustered they are in the middle of ECB’s range. Almost all banks (98%) received either a 2 or a 3 - that is some variation on ‘medium risk’. (Since 2021 the ECB has subdivided the medium risk SREP scores into 2+, 2, 2-, 3+, 3 and 3-) Only 2% (i.e. 2 banks) scored a 4 (Figure 1).
Figure 1: 2024 SREP scores distribution

source: ECB
This clustering in the middle of the SREP score range suggests that the difference in the overall health or riskiness of ECB-supervised banks are not very great. That may be entirely true and fair, though it would be a little surprising given the wide range of sizes and business models among the SI population. So we may instead be seeing evidence of ECB supervisors succumbing to central tendency bias, the phenomenon of appraisers over-using the central scores on a rating scale, and only awarding very high and very low marks in a small number of cases.
Either way, it is clear that the ECB sees room for all SIs to improve as none were deemed sufficiently ‘low risk’ to be awarded a best-in-class score of 1.
Same Scores, Different Year
Another remarkable feature of the 2024 SREP scores is their stability compared with previous years. Presenting the SREP results, Claudia Buch acknowledged that the latest assessment had ‘not resulted in major changes’ to the scores. This may even be an understatement: the 2.6 average score was exactly the same as in 2023; and the great majority of banks (74%) received the same score as last year (15% scored better than in 2023, and 11% scored worse).
Indeed, since the beginning of ECB supervision, the distribution of SREP scores has been remarkably stable (Figure 2).
Figure 2: SREP scores distribution 2015 - 2024
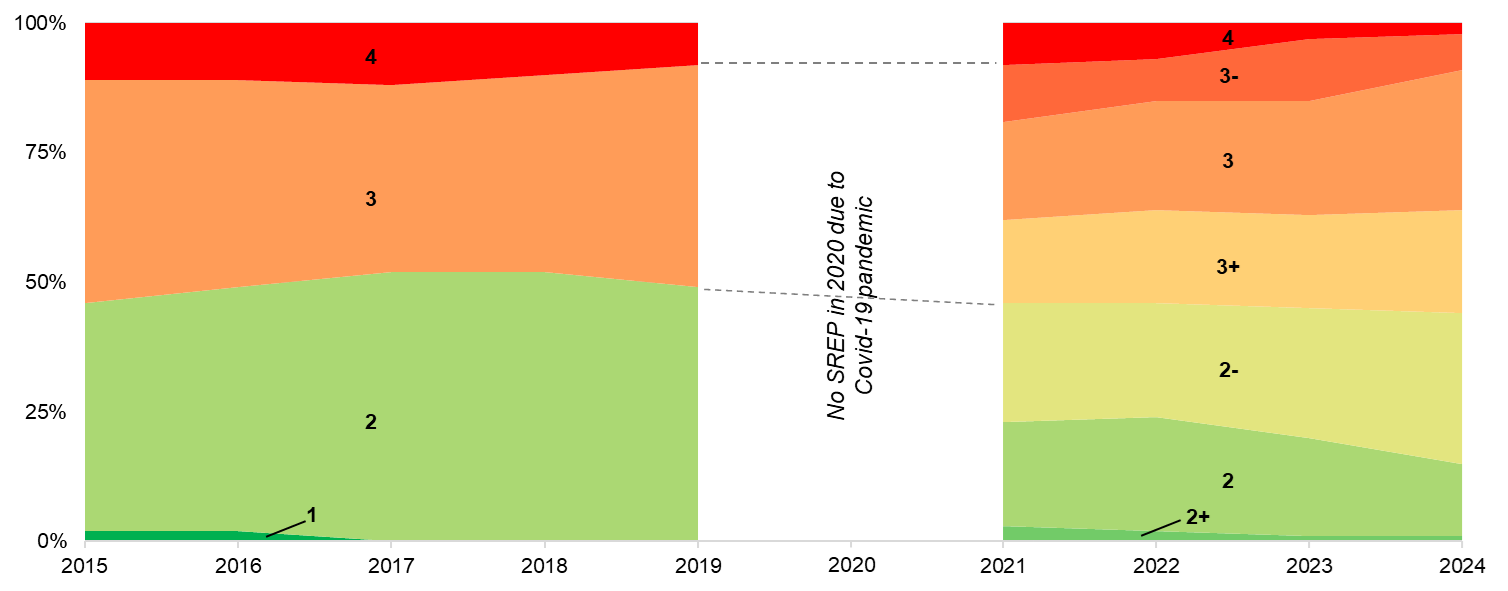
source: ECB
The combined share of banks scoring either a 2 or 3 has never fallen below 85%. Similarly, the “2 - 3 boundary” has hardly budged: in almost every year that the ECB has done the SREP just under half of SIs scored a 2 or better and just over half scored 3 or worse.
Signs of No Improvement?
Looking just at the SREP scores, you could be forgiven for thinking that not much has changed at European banks since 2015. You would certainly see little sign of the dramatic strengthening of SIs’ balance sheets since the start of ECB supervision. As Buch has repeatedly reminded us in recent months (for example at the SSM’s 10th anniversary celebrations), European banks have substantially improved their resilience. They have increased their capital ratios over the past decade, and have significantly improved their asset quality, with non-performing loan (NPL) levels falling sharply (before ticking up modestly during the latest economic slowdown) (Figure 3).
Figure 3: Aggregate CET 1 Capital and Non-Performing Loan ratios at Significant Institutions, 2015 - 2024
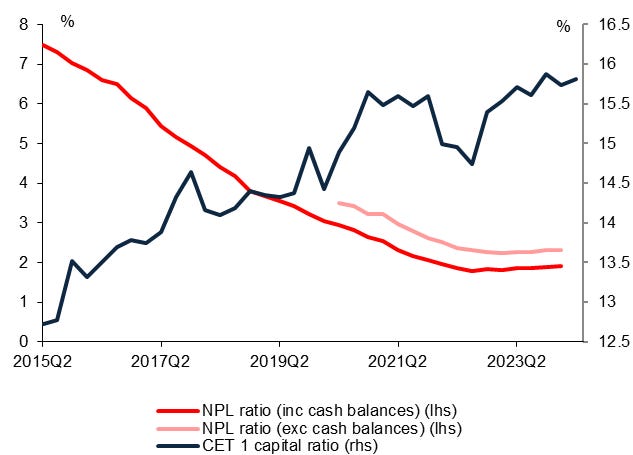
source: ECB
European banks thus look unquestionably healthier than in 2015. So why is this not reflected in their SREP scores?
Remaining Weaknesses
Part of the explanation may be persistent shortcomings in areas that are not captured in capital or NPL ratios. In practically every public speech or comment, ECB leaders point out that deficiencies remain in banks’ governance, risk management or business planning. These may weigh on at least some SREP elements (e.g. Internal Governance and Risk Management, typically where banks have scored worst) even as others improve. But it seems unlikely that these persistent problems would entirely offset the gains made in banks’ balance sheet resilience.
Problem Creep
Another factor must be problem creep. Over time as banks improve in some areas, supervisors find new failings to mark down. These could have been there all along but had gone undetected (because supervisors were too concerned about a bank’s NPLs, say, to have capacity to look closely at its governance structures). Or they could relate to entirely new concerns. The best example here is surely climate risk, which was not a priority in the early years of ECB supervision but has more recently become a key area of concern - and so an area where the ECB might find deficiencies that push down a bank’s SREP score.
Expectations Management
Finally, however technocratic supervisors may seek to be, they must always consider how their assessments will be perceived. Rate banks too poorly and they risk precipitating a loss of confidence (even a run). Rate them too well and they could undermine the credibility of their scores (a widespread criticism of the 2009 and 2010 EU bank stress tests). Grubbier political motivations can also play a part: the national representatives on the ECB’s Supervisory Board will surely object if they feel their country’s banks have been singled out as weak.
Weak Signals
Privately, ECB insiders tell me all of these factors have played a role. In the early years, they say, the ECB was deliberately over-generous. Since then the SREP scores have become more ‘realistic’ as banks’ true health has improved. Hence the extraordinarily stable scores. Maybe. But that makes it hard to know how seriously to take the latest scores. If they were made to flatter banks in the past, how do we know that they don’t do so any more? Or won’t again in future?
All this raises questions about how much the SREP scores really tell us about the health of European banks and how this has changed over the years. That risks weakening the SREP scores’ power to incentivise banks to improve (after all, if management reckon they will get the same score and capital requirement next year anyway, why go to the effort of tackling problems that supervisors have identified?). Indeed, the ECB’s recent emphasis on other enforcement tools, including financial penalties, could be an implicit recognition that they need additional means of prodding banks to act.
In her SREP reform announcement last May, Buch promised the ECB would make the SREP methodologies ‘more stable and, where possible, simpler and more transparent.’ I doubt supervisors will ever show us all the workings behind their final answers. But letting us see a little more ‘under the hood’ could strengthen the credibility of the ECB’s flagship assessment. And it will be interesting to see whether more stable methods will lead to less stable scores in the years ahead.